Agricultural input shocks
What we depend on to grow food and how
Food production today is more global than ever. Food trade ensures adequate and diverse food even in areas with low self-sufficiency. Foodstuffs are being traded across the world, but so are agricultural inputs such as fertilizers, machinery, and pesticides. Shocks and disturbances in the trade flows of agricultural inputs, caused by e.g. conflict, may be devastating to the food production and yields of otherwise self-sufficient countries. This aspect of food security and resilience requires more attention. In this study, we modelled the effects of agricultural input shocks using global spatial data on crop yields, fertilizers, machinery and pesticides with random forest, a machine learning algorithm.

Climate affects how crops grow. To eliminate that effect and only study agricultural inputs, we divided each crop into climate zones or bins according to growing degree days (GDD) and precipitation. We then analyzed and modelled each bin individually.
Check out the climate bins of all crops below.
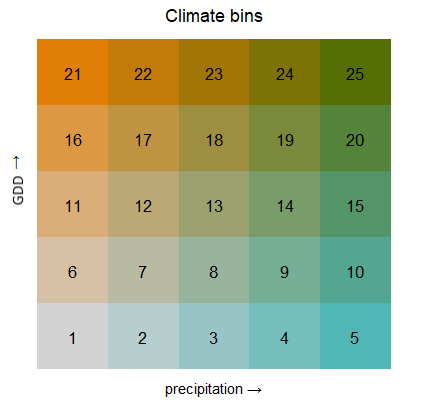
Climate bins
Visualize crop yields and agricultural inputs in maps and as averages in each climate bin.
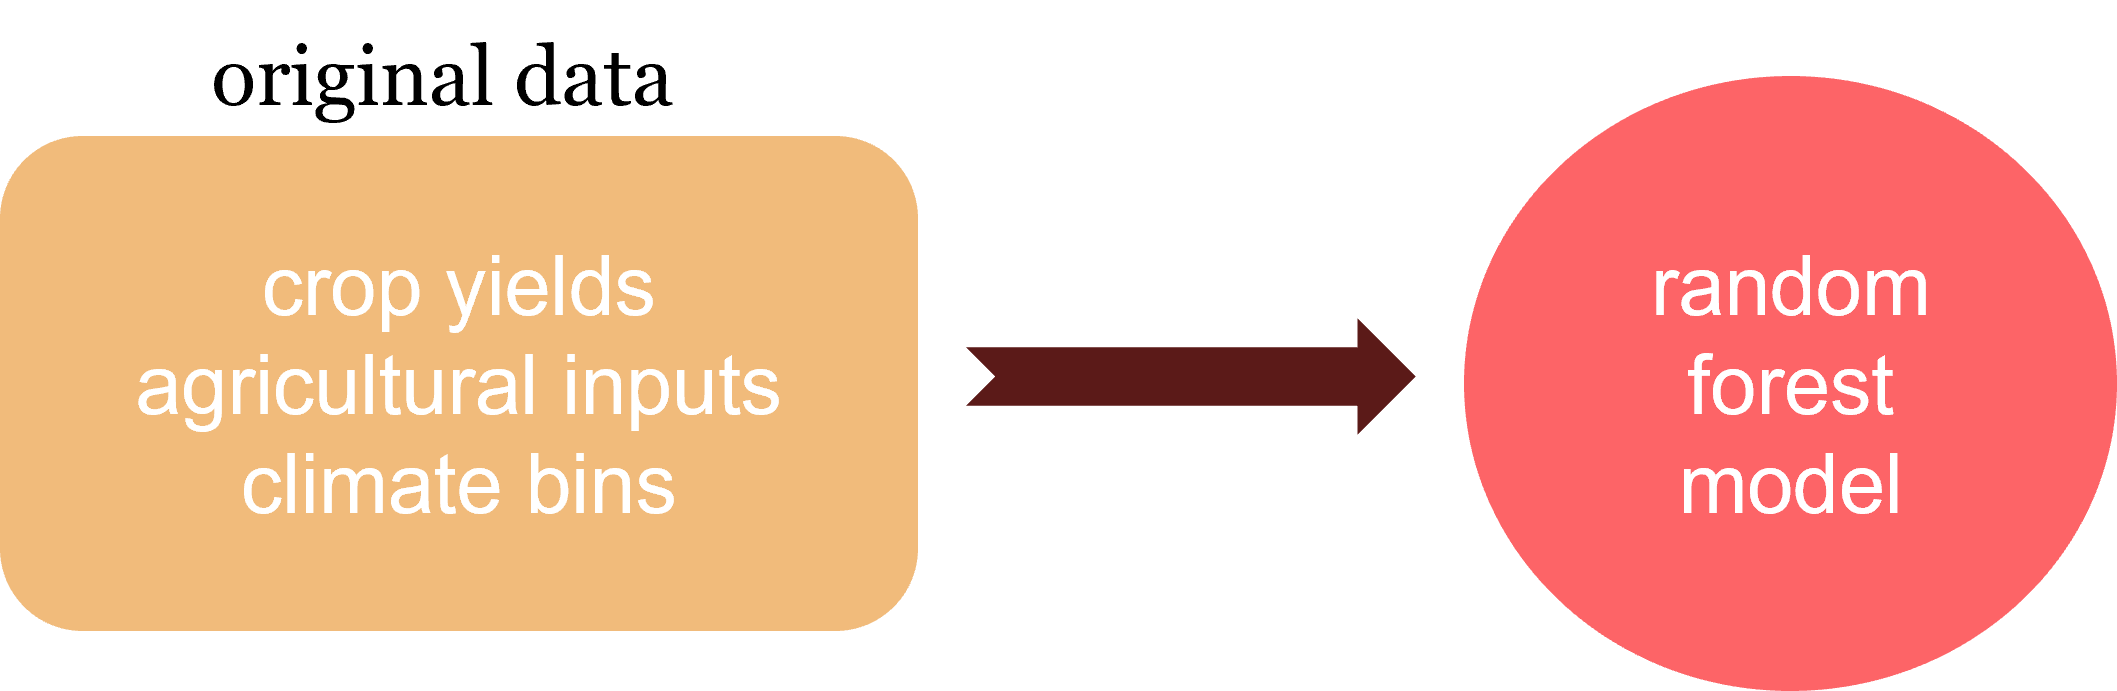
How did we model the effects of agricultural input shocks on crop yields?
Random forest is a machine learning method. It builds hundreds of decision trees or regression trees and then the model output is an average of all the trees.
We built a model with the random forest algoritm and global data of crop yields, nitrogen fertilizer, phosphorus fertilizer, potassium fertilizer, agricultural machinery, and pesticides. Then we used that model to predict how decreases or shocks in different agricultural inputs would affect yields.
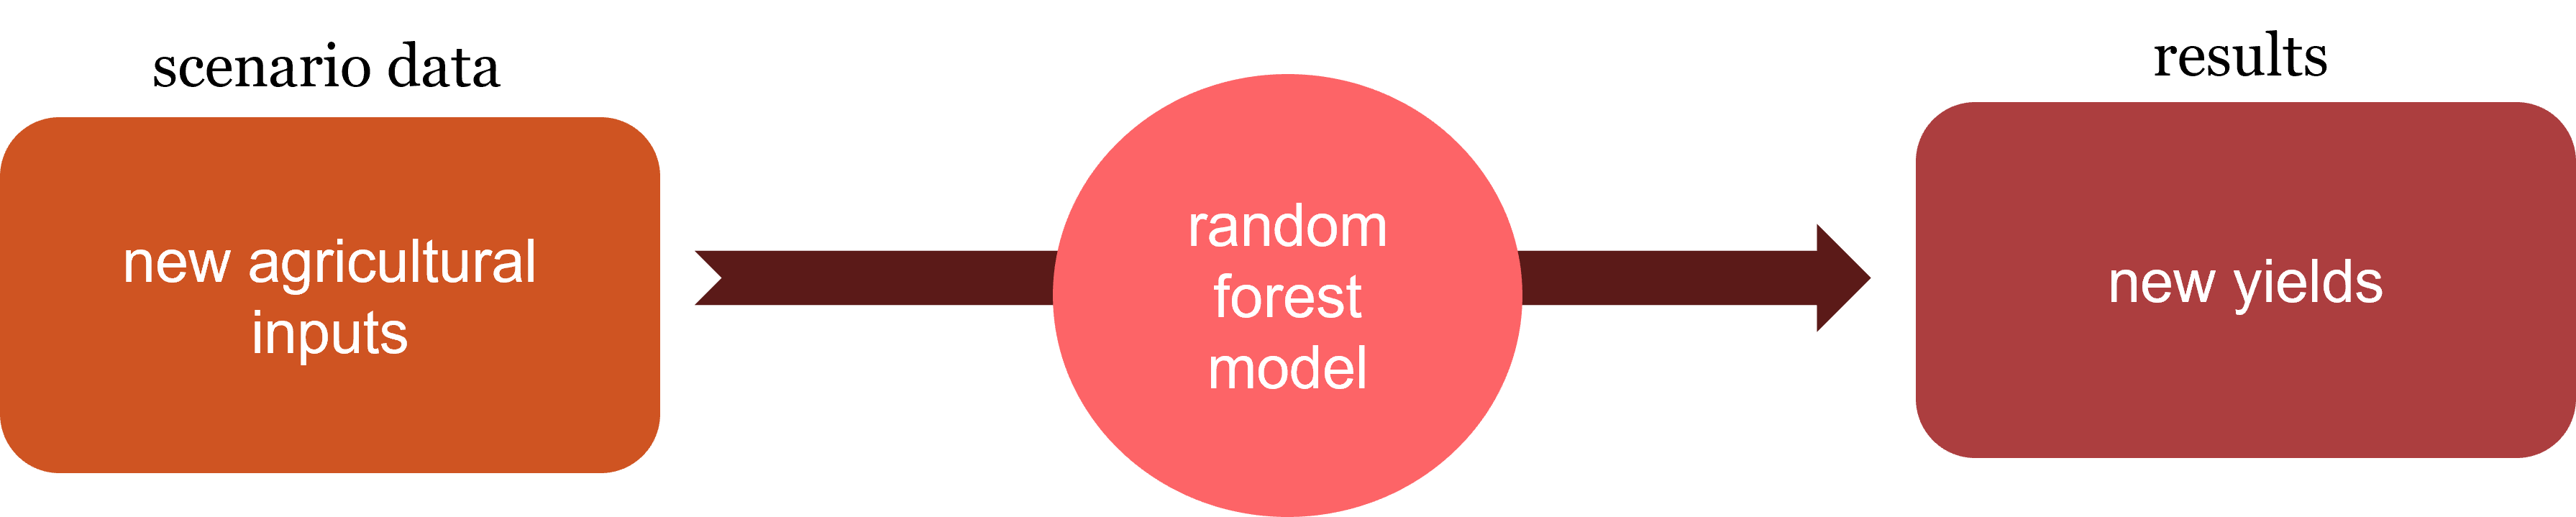
To model agricultural input shock scenarios, new data was created with a decrease of 25%, 50% or 75% in either: nitrogen, phosphorus, potassium, machinery, or pesticides, or in all fertilizers or in all inputs togehter. See results in the following pages!
Draw maps from different angricultural input shock scenarios
Examine scenario shocks from tileplots
Examine shock scatterplots with different agricultural inputs.
The effects of agricultural input shocks can also be examined through production, or total volume of cultivated crop.
Production is yield * harvested area. In this barplot you can examine shock effects on the global production of different crops individually.
In the tabs All crops you can see the effects on all 12 crops summed together. In the tab All countries production decreases are summed for whole countries.
Change in production for all 12 crops after 50% shock in all inputs
Countrywise change in the total production of all 12 crops after 50% shock in all inputs
Model performance can be measured by comparing results generated by the model to results we know previously. In this case, random forest modelled yields that we compared to known yields. NSE or Nash-Sutcliffe Efficiency is one measure of the models predicting power. A model with NSE score 1 is a perfect model, and models between 0-1 are acceptable. Models with NSE > 0.65 are good and NSE > 0.75 are very good.
RMSE or Root Mean Square Error is another measure of model performance. Here we see RMSE-values calculated from when training the model (train) and then again when testing with external data (test). If the RMSE-scores are not significantly different between train and test, the model does not overfit.